Oil storage
from space.
Sentinel-1 radar images of floating-roof tanks show how full they are. We turn them into a weekly forecast of crude oil stocks at Cushing, Oklahoma, ahead of the official EIA figures.
Explore this week’s forecastThis week
Every Tuesday evening we freeze our estimate of how much the crude oil stored at Cushing changed over the past week. On Wednesday the U.S. Energy Information Administration (EIA) publishes the official figure, and it appears here next to ours. Figures are in kbbl (thousand barrels): + means stocks rose, − means they fell.
Loading…
Track record
How our weekly forecasts compare with the official EIA figures, counted from the first live forecast on. Hit rate: how often we got the direction (up or down) right. Mean absolute error: the average size of our miss in thousand barrels, lower is better. Both are set against the AR(1) baseline, a simple statistical forecast without satellite data.
Loading…
Data freshness
The forecast relies on the Sentinel-1 radar satellite, which passes over Cushing every 12 days (at times every 6). An image is used once it is available to us, usually a few days after it was taken; weeks without a new image fall back on the earlier ones.
Loading…
Tank map
Each circle is one storage tank, shaded by how full it was at its latest radar measurement. Only floating-roof tanks can be measured: their roof floats on the oil and rises and falls with it. Select a tank to see its fill level since 2016.
Loading…
Terminal areas
The same tanks grouped by terminal area. Fill is the average of the floating-roof tanks, weighted by their size. The 4-week trend is the change of that fill in percentage points (pp) over about four weeks (the radar image closest to 28 days earlier).
Loading…
Cushing since 2016
Cushing, Oklahoma is one of the largest crude oil storage hubs in the United States and the delivery point of the WTI oil futures contract. The chart compares the total stock level seen from space with the official EIA figure. Marked: the 2018 low, the spring 2020 fill when storage nearly ran out of space, the lows of 2022 and 2023, and the lowest level of the whole period in July 2026.
Loading…
Backtest (2018–2026)
Before going live we replayed the forecast week by week from 2018 to 2026, each time using only data that would have been available then: a radar image counts from 72 hours after the European Space Agency (ESA) processed it, as in live operation. It starts in 2018 because the method first needs about two years of earlier images to calibrate against.
Loading…
China coastal storage Experimental
A test of the same method at two Chinese import terminals. China publishes no weekly stock figures, so the satellite index is compared with a monthly estimate derived from official production, import and refinery data. Figures there are in kbd (thousand barrels per day).
Loading…
How it works
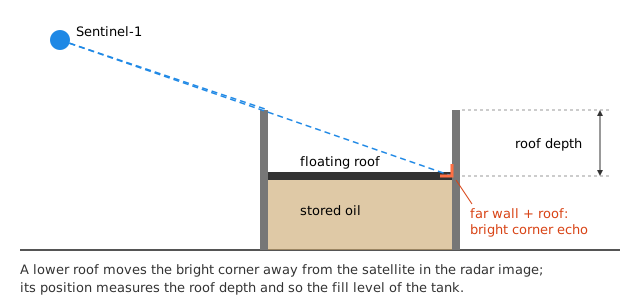
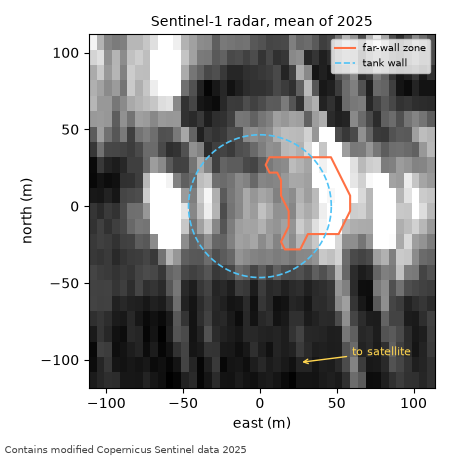
We use free images from Sentinel-1, a European radar satellite of the Copernicus programme. Radar sees through clouds and works day and night, so every pass over Cushing gives a usable image.
What we found
- At Cushing, free Sentinel-1 radar predicts the weekly EIA stock change better than a statistical baseline in an eight-year backtest.
- The same method did not transfer to the Gulf Coast tank fields.
- We found no tradable edge in oil prices from these forecasts.
- Longer horizons (monthly fill or drain trends) did not beat simple baselines.
- At Chinese coastal terminals the radar signal is real, but we found no market reaction to it.
Questions and answers
Can satellites see how much oil is stored at Cushing?
Yes, for floating-roof tanks. Their roof floats on the oil, so it sits high when the tank is full and low when it is empty. Satellite images show how far the roof has sunk below the tank rim, which gives the fill level. Adding up the tanks gives an index of the crude oil stored at Cushing.
Why Sentinel-1 radar and not ordinary satellite photos?
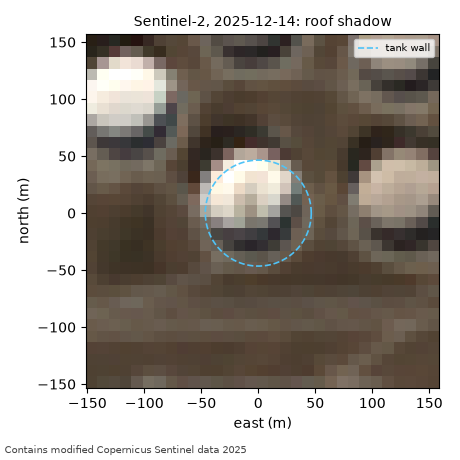
Sentinel-1 is a radar satellite of the European Copernicus programme, and its images are free. Radar sees through clouds and works at night, so every pass over Cushing gives a usable image. Optical images such as Sentinel-2 show the roof shadow too, but clouds block many of them.
How often is there a new image?
Sentinel-1 passes over Cushing every 12 days, at times every 6. Weeks without a new image fall back on the earlier ones.
When is the forecast published?
Every Tuesday evening we freeze our forecast of the weekly change in Cushing crude stocks. The U.S. Energy Information Administration (EIA) publishes the official figure, usually on Wednesday, and it appears on this page next to ours.
How accurate is it?
In an eight-year backtest from 2018 to 2026, the satellite forecast of the weekly EIA change at Cushing beat a simple statistical baseline. The track record on this page shows how it does live. We found no tradable edge in oil prices from these forecasts; nothing here is investment advice.
Why does Cushing matter?
Cushing, Oklahoma is one of the largest crude oil storage hubs in the United States and the delivery point of the WTI crude oil futures contract, so the oil market watches its stock level closely.
Is the data free?
Yes. The forecasts, the track record and the Cushing and China indexes are free to download as CSV files on this page.
Downloads
The data behind this page as CSV files, which open in any spreadsheet.
How to verify a forecast hash
Take every field of a forecast row except row_hash and serialise them as one JSON object with sorted keys, no whitespace (separators , and :), UTF-8, and no non-finite numbers. Dates are YYYY-MM-DD and timestamps are UTC exactly as returned, floats use the shortest round-trip form (50000.0, 1e-07). The row_hash is the lowercase hex SHA-256 of that text.
import hashlib, json
fields = {k: v for k, v in response.items() if k != "row_hash"}
text = json.dumps(fields, sort_keys=True, separators=(",", ":"), allow_nan=False)
assert hashlib.sha256(text.encode()).hexdigest() == response["row_hash"]
Notices
Not investment advice.
Contains modified Copernicus Sentinel data 2026
Stock data: U.S. Energy Information Administration (EIA).